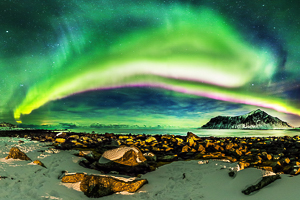
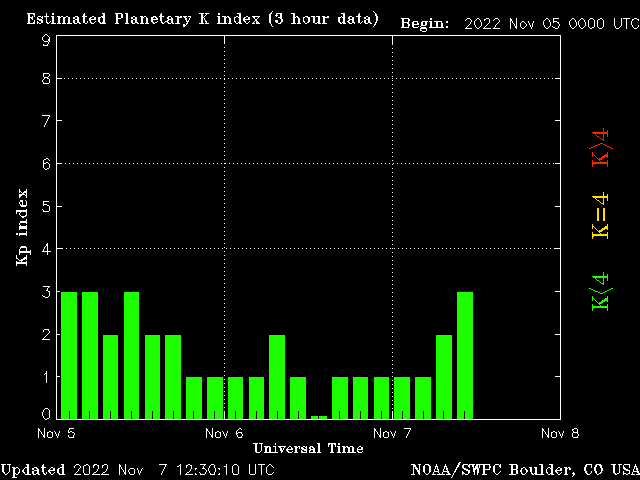
 The National Oceanic and Atmospheric Administration (NOAA) has implemented a real-time northern light prediction map for each hemisphere.
This map gives a forecast, for the next 30 to 40 minutes, showing the size of the aurora and the places in the world where it can be observed. The probability as well as the intensity of the light is represented by a gradient of colors (going from green to red).
Note: In order to observe the northern lights, it is essential that the sky is cloudfree. Therefore it is important to cross the data below with the one of the local weather forcast.
Here you'll find the last update of the map.


